Specifying Additional Filtering for Listings
Specifying Additional Filtering for Listings
By default, when a user displays a detail listing, the system displays one row for each source record that is used in the current context (that is, the context in which the listing was requested). For a given measure, you can specify an additional filter for the system to use when displaying the detail listing. For example, consider the Avg Test Score measure in the Patients sample. This measure is based on the TestScore property, which is null for some patients. You could redefine this measure to filter out those patients, when the user starts on the Avg Test Score measure and then displays a listing.
If you need such a filter, you include it as part of the measure definition. In most cases, the filter has the following form:
measure_value operator comparison_value
This filter is added to the detail listing query and removes any records that do not meet the filter criteria.
The other form of listing filter is MAX/MIN. If you use such a listing filter, the detail listing shows only the records that have the maximum (or minimum) value of the measure. The measure must use the same kind of aggregation as does the listing filter (if a listing filter is included).
To specify an additional filter for listings, for a specific measure:
-
Select the measure in the Model Viewer.
If you intend to use MAX for the listing filter, select a measure that is defined with Aggregate as MAX.
Similarly, if you intend to use MIN, select a measure that is defined with Aggregate as MIN.
-
In the section Measure-Specific Listing Filter (in the Details Area), specify the following values:
-
Operator — Select one of the following: < <= > >= <> = MAX MIN
-
Value — Specify the comparison value. Omit this option if Operator is MAX or MIN
-
When you use this option, the Architect automatically enables the Searchable check box, because this measure must be searchable.
Example
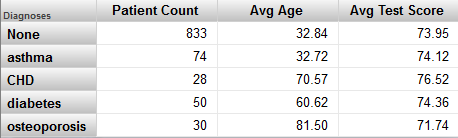
Suppose that we modify the Avg Test Score measure in the Patients cube, and we specify Operator as <> and Value as "". That is, we want to filter out the patients that have null test scores. Then consider the following pivot table:
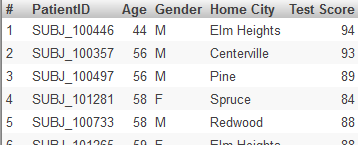
If we click the Patient Count cell (or the Avg Age cell) in the CHD row and then display a detail listing, we see something like this:
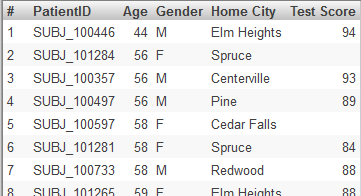
But if we click the Avg Test Score cell in the pivot table and then display a detail listing, we see fewer records, like this: