Widget Variations
Widget Variations
This section shows the contents of different types of widgets that you might see in your dashboards.
Pivot Table Widgets
A pivot table widget displays data in one of three formats:
-
As a table with aggregated values. For example:
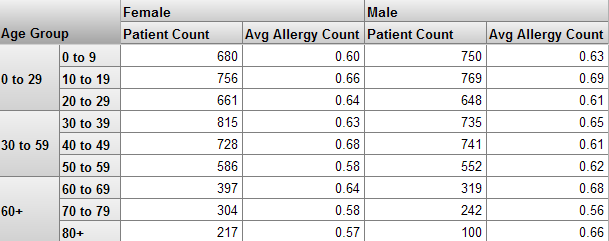
-
As a chart. For example:
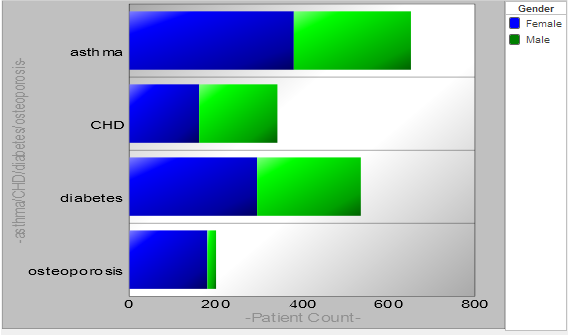
-
As a listing, which is a table of the lowest-level values. For example:
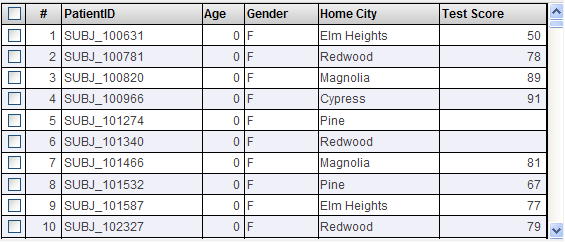
If there are more than 100 rows, the bottom area displays buttons that you can use to page through all the rows.
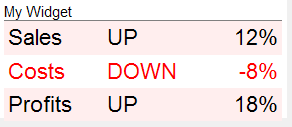
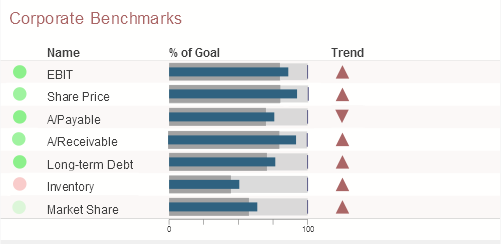
Scorecard Widgets
A scorecard widget displays one or more rows of data in a tabular format that also includes features such as value-dependent lamps and arrows. For example:
Meter Widgets
A meter widget displays one or more values, each in a graphical object as follows:
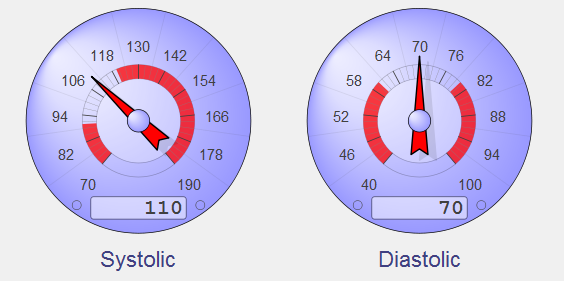
The preceding picture shows a speedometer. The system also supports text meters. For example:
Map Widgets
A dashboard can include a map widget like the following:
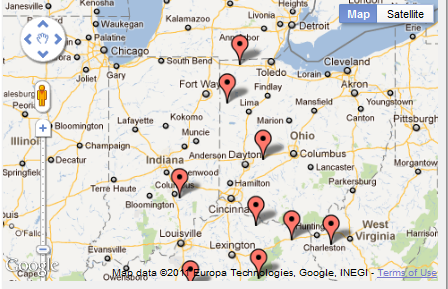
The highlighted points typically correspond to locations that are relevant to your business.
Calendar Widgets
A dashboard can include a calendar widget like the following:
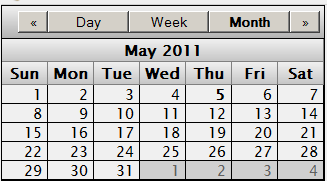
This widget is included purely as information; it is not connected to your data.
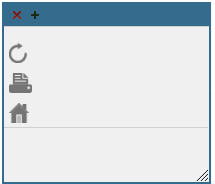
Controls Widgets
A controls widget consists only of toolbar controls and has no main body content. The following shows an example:
Custom Widgets
A dashboard can also include custom widgets called portlets. The following shows an example: