
Using the Activity Monitor Dashboard
Using the Activity Monitor Dashboard
The Activity Monitor Dashboard is an Analytics dashboard that displays the activity statistics. To go to the dashboard, ensure that you are in the namespace being used to collect statistics and select Interoperability > Monitor > Activity Volume and Duration. The dashboard is defined in the class Ens.DeepSee.ActivityVolumeAndDurationDashboard Opens in a new tab.
The dashboard displays current activity information for each production configuration item.
You can select the statistics to display by time period, instance, namespace, and site dimension:
-
Period of Time—After selecting the time period, select the check mark to set it. The options are:
-
Minute—displays the activity in the previous minute.
-
Hour—displays the activity in the previous hour.
-
Day—displays the activity in the previous day.
-
Week—displays the activity in the previous week.
-
Month—displays the activity in the previous month.
-
Year—display the activity in the previous year.
-
All—displays all the stored statistics.
-
-
Instance—You can select the instance of InterSystems IRIS that you want to view the activity. If you select the instance, then the instance name is not included in the name column. This reduces the width of the table and helps it fit on the screen. After selecting the instance, select the check mark to set it.
Note:The Analytics dashboard user interface supports the ability to display statistics from multiple instances of InterSystems IRIS, but the mechanism to gather statistics from multiple instances is experimental and should not be used in production environments.
-
Namespace—You can select the namespace that you want to view the activity. If you filter on a namespace, then the namespace does not appear in the name column, reducing the width of the display.
-
Site Dimension—Custom property set by code. See the RecordStats()Opens in a new tab method or to the SetStatsUserDimension()Opens in a new tab method for information on setting the site dimension.
You can sort the statistics by: Name, Total Count, Avg. Duration, or Avg. Queue Time.
The dashboard automatically refreshes every 60 seconds. You can also refresh it by selecting Refresh. The Reset button resets the selection fields to their initial default values.
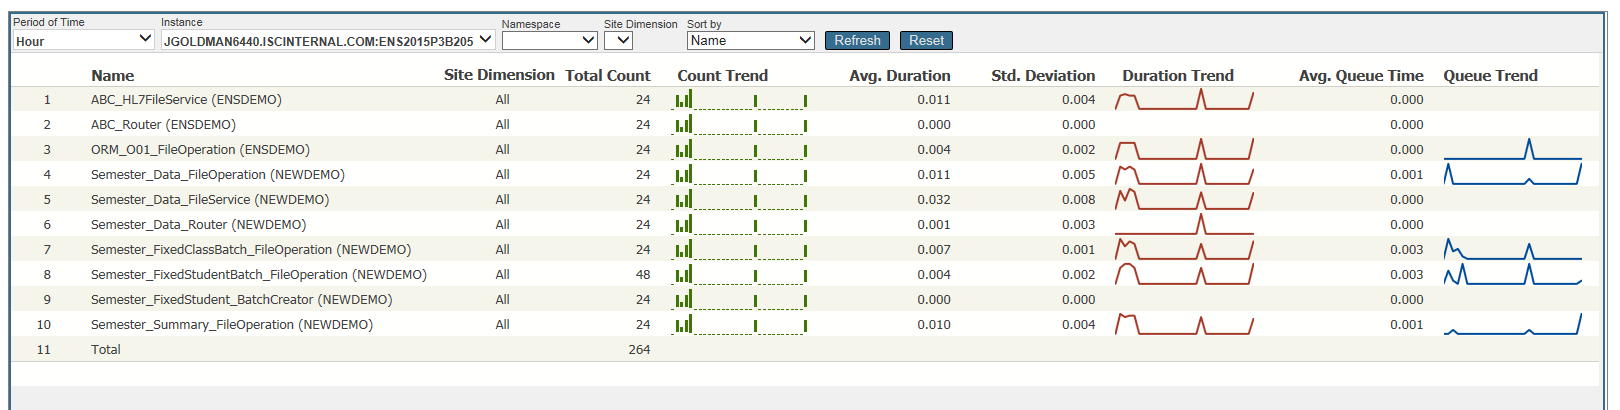
For each configuration item reporting statistics, the dashboard displays the following information:
-
Name—The configuration item name in the production. The instance and namespace are included in parentheses. If you have filtered activity based on instance or namespace, that item is omitted.
-
Site Dimension—Identifying information that can be included by custom code. If you filter by the site dimension, this column displays the site dimension value. Otherwise it displays “All”.
-
Total Count—Total number of messages during the specified time period.
-
Count Trend—Graphic representation of the count within the specified time period. For example, if the time period is a week, the graph shows the count for each day in the week.
-
Average Duration—Average time to process the message in the component.
-
Standard Deviation—Standard deviation on the times needed to process the message in the component.
-
Duration Trend—Graphic representation of the average duration within the specified time period.
-
Average Queue Time—Average time message remained on the queue during the specified time period.
-
Queue Trend—Graphic representation of the average queue wait time within the specified time period.
Although this dashboard can only display activity for the previous minute, hour, day, week, month, or year, you can design your own dashboard with more flexibility. For example, you could create a dashboard that displays the activity from 9AM to 6PM for a specified day.